

We pulled every Florida flood claim in the federal NFIP register: 448,536 records covering 1978 to 2026, with $19.31 billion paid out. This Florida water damage analysis is not a FEMA report and not a summary of news coverage. It is our own extract of open federal data, taken through the OpenFEMA API on 28 July 2026.
Why this sits on a site about humidity
Flood insurance does not cover most of what we usually write about. Pipe leaks, condensation and mold fall outside the program entirely. But the claims register answers the question underneath all of those topics: how a Florida house is built, and where water gets into it. There are 448,536 recorded cases here, each carrying a foundation type, a year of construction and a cause of loss. The data is federal and open; we pulled the full Florida slice and did the analysis ourselves, including normalization against the housing stock by county and by ZIP code.
What you will find below
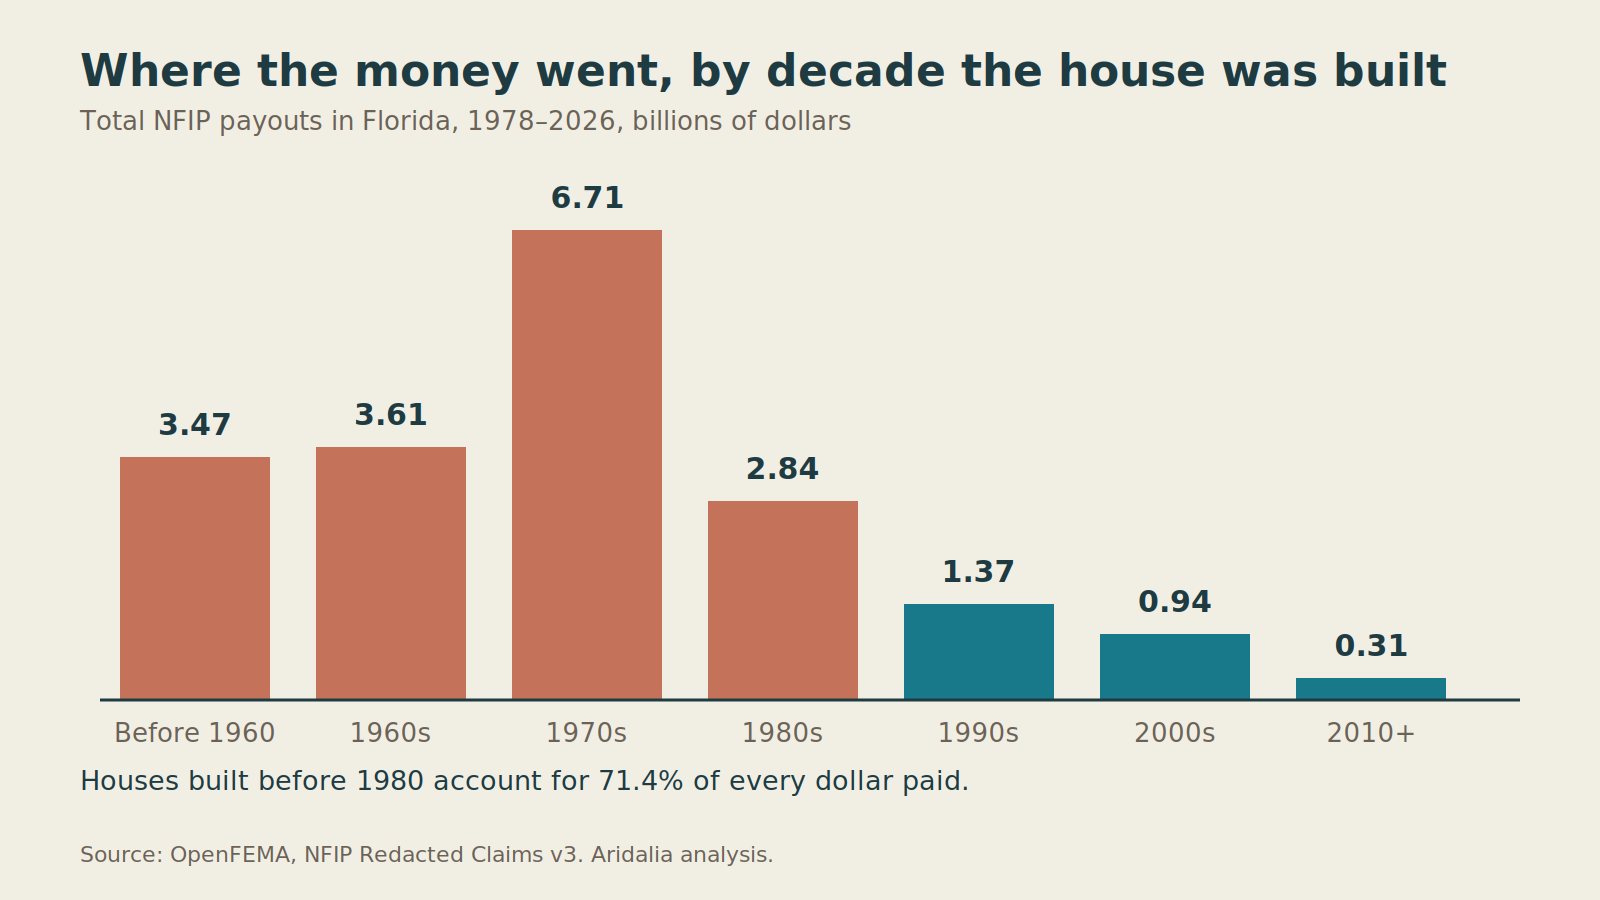
- The age of the house outweighs the distance to water. Homes built before 1980 account for 71.4% of every dollar paid.
- One payout in nine landed outside the flood zone. 10.9% went to Zone X, where owners rarely buy coverage.
- Three geographic rankings, not one. Where the money is, where everyone gets hit, and where the typical case is worst are three different lists of counties and ZIP codes.
- Slab foundations dominate. 73.3% of claims and a median payout of $62,339, against $8,497 for a house on pilings.
- Basements are 0.6% of the register. A number to put against any guide telling a Florida homeowner to check the basement for damp.
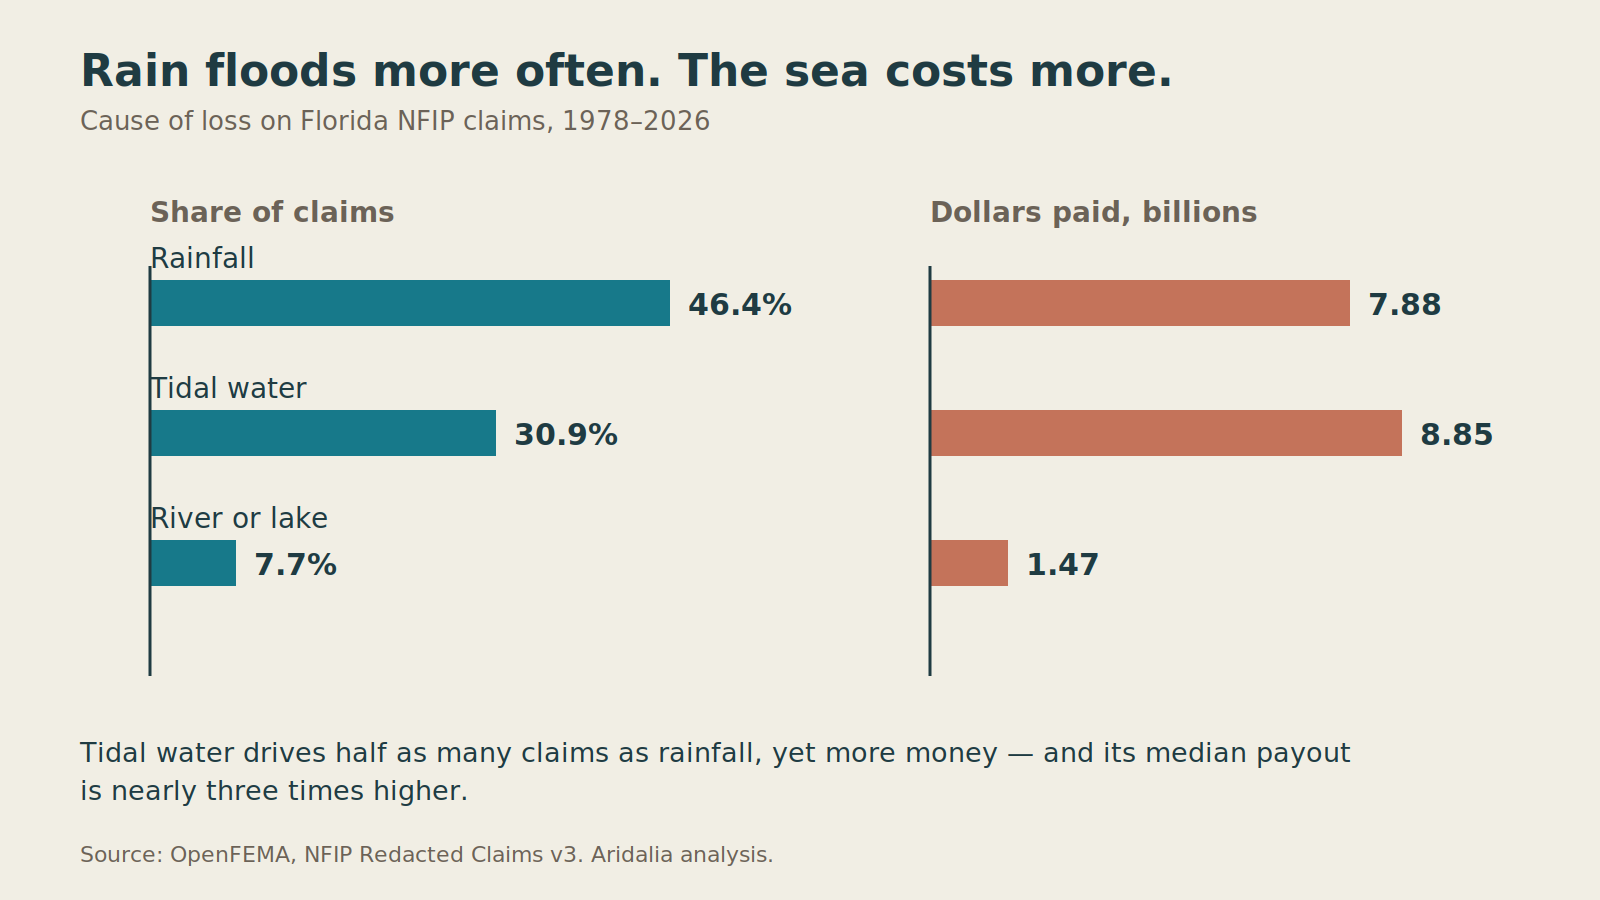
- Rain floods more often, the sea costs more. 46.4% of claims against 30.9%, yet tidal water carries the larger share of the money.
One caveat runs through the whole page: NFIP covers flooding only, meaning external water rising onto normally dry land. Every figure here is a floor on Florida water damage, not the full picture.
Method
Dataset: NFIP Redacted Claims, version 3, filtered to Florida, 18 fields per claim. A payout is the building claim plus the contents claim. Of the 448,536 claims, 313,575 resulted in money changing hands (69.9%), with a median non-zero payout of $19,267. The full procedure is set out on our methodology page.
The age of the house matters more than the distance to water
On smaller screens, scroll the table to see every column.
| Year built | Claims | $ billion | Median payout |
|---|---|---|---|
| Before 1960 | 84,892 | 3.47 | $6,539 |
| 1960–69 | 62,238 | 3.61 | $14,868 |
| 1970–79 | 129,540 | 6.71 | $8,023 |
| 1980–89 | 85,750 | 2.84 | $3,349 |
| 1990–99 | 47,647 | 1.37 | $2,610 |
| 2000–09 | 27,926 | 0.94 | $3,816 |
| 2010 and later | 9,168 | 0.31 | $4,419 |
Houses built before 1980 account for 61.7% of claims and 71.4% of all money paid. The 1970s alone produced $6.71 billion, more than any other decade. After 1990 the volume falls by a factor of four, which tracks the arrival of elevation requirements, FIRM mapping and post-code construction.
An honest qualifier belongs here. Coastal Florida holds more old houses, and older properties are more likely to be required to carry a policy. The correct reading is that homes of these years dominate the payout statistics, not that they flood more often.
Zone X: one payout in nine landed outside the high-risk zone
48,869 payouts, or 10.9% of the total, went to properties in Zone X, outside the special flood hazard area. That is the answer to “I am not in a flood zone, so I do not need the coverage.” It is a fact drawn from the payout register, not an estimate of flood probability.
Geography: three lists instead of one
A single ranking would mislead. The absolute sum shows where the most money went. Normalizing against the housing stock shows where everyone gets hit. The median shows how heavy a typical case is.
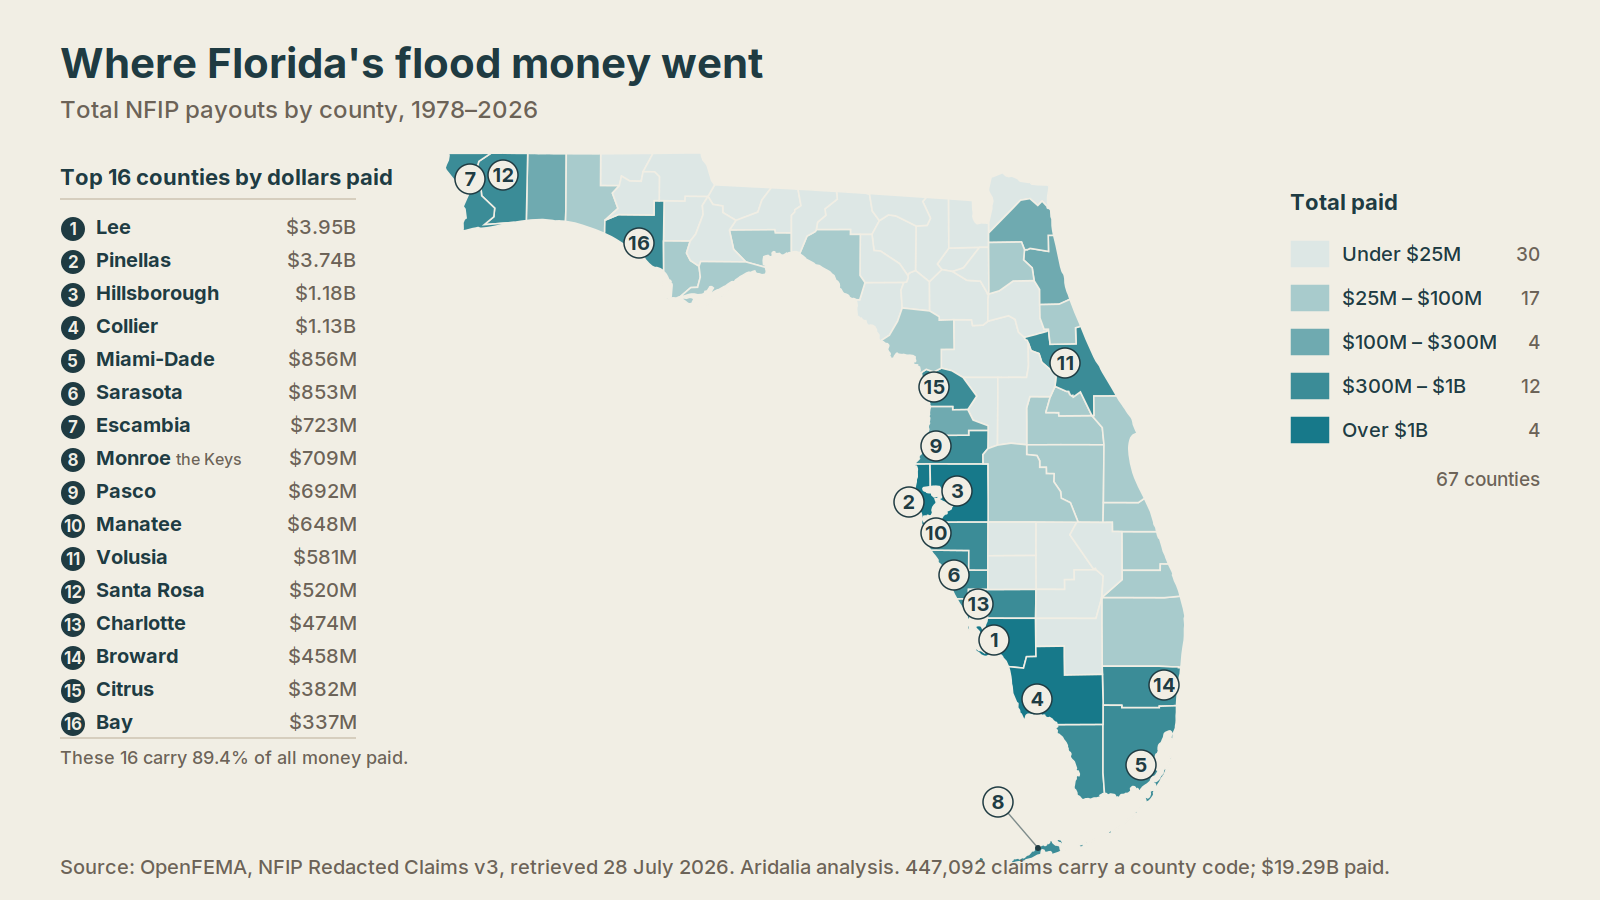
The map is the absolute view. Two counties on the Gulf, Lee and Pinellas, account for $7.70 billion between them, close to two fifths of everything paid in the state. The tables below take the same data and divide it by housing stock, which produces a different set of names entirely.
Counties: claims per 1,000 residential structures
On smaller screens, scroll the table to see every column.
| County | Claims | $ million | Per 1,000 homes | $ per home | Policy coverage |
|---|---|---|---|---|---|
| Monroe | 27,430 | 709 | 720.3 | 18,621 | 59.0% |
| Santa Rosa | 10,438 | 520 | 149.7 | 7,454 | 14.5% |
| Lee | 48,493 | 3,954 | 139.8 | 11,397 | 24.8% |
| Escambia | 16,498 | 723 | 136.4 | 5,980 | 8.5% |
| Pinellas | 51,764 | 3,745 | 132.2 | 9,560 | 19.8% |
| Miami-Dade | 62,027 | 855 | 126.0 | 1,738 | 33.7% |
| Bay | 9,002 | 337 | 120.1 | 4,492 | 18.3% |
| Charlotte | 11,696 | 474 | 116.2 | 4,713 | 32.6% |
| Okaloosa | 8,221 | 282 | 102.9 | 3,533 | 10.4% |
| Citrus | 7,076 | 383 | 89.8 | 4,852 | 7.1% |
| Collier | 14,771 | 1,131 | 84.8 | 6,491 | 30.3% |
| St. Johns | 7,637 | 250 | 78.9 | 2,583 | 23.7% |
| Manatee | 11,386 | 648 | 69.2 | 3,938 | 17.6% |
| Sarasota | 14,411 | 853 | 68.5 | 4,052 | 18.4% |
| Hillsborough | 18,549 | 1,178 | 41.4 | 2,628 | 12.3% |
Counties holding more than 15,000 residential structures. Denominator: NFIP residential penetration data, April 2026.
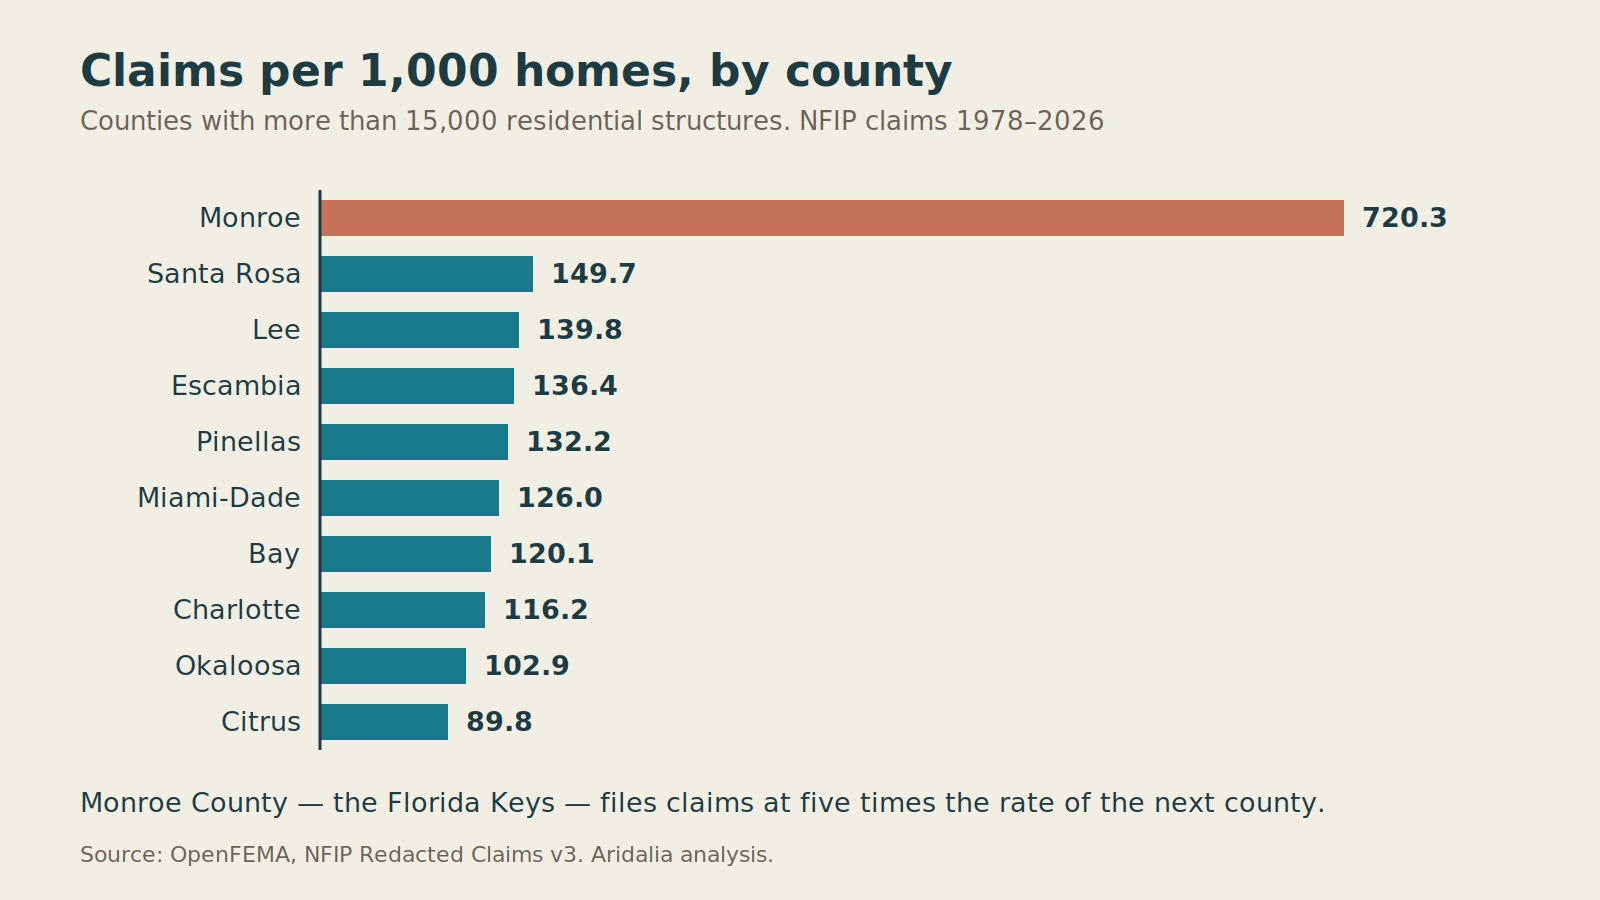
Monroe County, the Florida Keys, records 720 claims per thousand residential structures and $18,621 paid per home across the life of the program. Miami-Dade leads on raw claim count with 62,027, yet works out to $1,738 per home: heavy volume, light losses. Hillsborough ranks third by absolute dollars and lands at the bottom of the normalized list, which is purely an effect of county size.
The last column carries its own story. Monroe has policies on 59% of its housing, Escambia on 8.5%, Citrus on 7.1%. Where coverage is thin, the NFIP register sees only a fraction of the real damage, and totals for those counties understate reality more than elsewhere.
ZIP codes: top 15 by dollars paid
On smaller screens, scroll the table to see every column.
| # | ZIP | What this is | Claims | $ million | Median $ |
|---|---|---|---|---|---|
| 1 | 33908 | Lee County, unincorporated | 8,401 | 887 | 40,000 |
| 2 | 33931 | Fort Myers Beach and adjoining Lee County | 7,645 | 707 | 16,854 |
| 3 | 33957 | Sanibel | 7,057 | 694 | 15,000 |
| 4 | 33706 | St. Pete Beach and Treasure Island | 7,274 | 637 | 14,581 |
| 5 | 33703 | St. Petersburg | 7,742 | 563 | 34,197 |
| 6 | 33708 | Madeira Beach, Redington Beach, Redington Shores | 7,626 | 534 | 10,809 |
| 7 | 34242 | Sarasota County, unincorporated | 4,459 | 346 | 12,925 |
| 8 | 34102 | Naples | 3,181 | 341 | 25,131 |
| 9 | 32507 | Escambia County, unincorporated | 5,669 | 294 | 7,776 |
| 10 | 34652 | New Port Richey and adjoining Pasco County | 3,751 | 283 | 28,223 |
| 11 | 32561 | Pensacola Beach | 7,463 | 278 | 8,343 |
| 12 | 34134 | Bonita Springs and surrounds | 2,711 | 274 | 21,754 |
| 13 | 33040 | Key West and adjoining Monroe County | 8,242 | 273 | 7,672 |
| 14 | 33707 | four Pinellas County jurisdictions | 2,237 | 272 | 67,579 |
| 15 | 33702 | St. Petersburg | 3,490 | 259 | 29,756 |
1,365 ZIP codes appear in the Florida extract. The top twenty carry 40.6% of all payouts in the state.
The median column is a second signal, independent of the total. In 33707 it stands at $67,579 across 2,237 claims: flooded through, and expensively. In 33040 it is $7,672 across 8,242 claims: widespread and shallow. Similar money, two entirely different situations for a homeowner.
ZIP codes: claims per 1,000 housing units
On smaller screens, scroll the table to see every column.
| # | ZIP | What this is | Housing units | Claims | Per 1,000 units | $ per unit |
|---|---|---|---|---|---|---|
| 1 | 32561 | Pensacola Beach | 6,591 | 7,463 | 1,132.3 | 42,233 |
| 2 | 33042 | Monroe County, unincorporated | 4,835 | 5,022 | 1,038.7 | 15,163 |
| 3 | 33786 | Belleair Beach | 1,207 | 1,156 | 957.7 | 62,929 |
| 4 | 33043 | Monroe County, unincorporated | 3,003 | 2,678 | 891.8 | 19,028 |
| 5 | 33924 | Lee County, unincorporated | 1,666 | 1,433 | 860.1 | 18,849 |
| 6 | 33957 | Sanibel | 8,525 | 7,057 | 827.8 | 81,441 |
| 7 | 33051 | Key Colony Beach | 1,132 | 927 | 818.9 | 34,805 |
| 8 | 33050 | Marathon and adjoining Monroe County | 7,314 | 5,286 | 722.7 | 21,036 |
| 9 | 33703 | St. Petersburg | 12,331 | 7,742 | 627.8 | 45,663 |
| 10 | 34216 | Anna Maria | 1,858 | 1,133 | 609.8 | 36,670 |
| 11 | 33708 | Madeira Beach, Redington Beach, Redington Shores | 13,211 | 7,626 | 577.2 | 40,444 |
| 12 | 32625 | Cedar Key and adjoining Levy County | 1,262 | 712 | 564.2 | 26,163 |
| 13 | 33921 | split between Lee and Charlotte counties | 1,749 | 984 | 562.6 | 29,251 |
| 14 | 34429 | Crystal River and adjoining Citrus County | 5,458 | 3,020 | 553.3 | 36,809 |
| 15 | 34217 | Holmes Beach and Bradenton Beach | 5,940 | 3,183 | 535.9 | 37,957 |
Denominator: ACS 5-year 2023, table B25001. Housing stock of 1,000 units and above. Of the 1,365 ZIP codes in the register, 963 matched a census tabulation area.
The ranking inverts. Absolute dollars put the large coastal ZIP codes of Fort Myers and St. Pete on top; normalization brings the barrier islands and the Keys forward instead. Pensacola Beach recorded 1,132 claims per thousand housing units over 48 years, more than one claim per structure. Sanibel shows $81,441 paid per housing unit across the same span.
How to read the “what this is” column
A ZIP code is a postal unit, not an administrative boundary, so a single code can sit across several jurisdictions. We took the community name from the NFIP claims themselves. Where one community covers the overwhelming majority of records, that name stands alone. Where a city shares its ZIP code with the unincorporated part of its own county, both are named. Where the code is split between separate municipalities or between two counties, we do not reduce it to a single name. The wording “unincorporated” follows the FEMA convention marking the unincorporated areas of a county.
Qualifiers that apply to all three lists
The county map covers 447,092 of the 448,536 claims: 1,444 records carry no county code and cannot be placed on a map, which is why its total reads $19.29 billion against the $19.31 billion for the state as a whole.
The numerator in every case accumulates over 1978–2026, while the denominator reflects housing stock in 2023–2026. Rapidly built-up areas are understated and stagnant ones overstated. Figures given per home and per unit cover the life of the program, not a single year. Census tabulation areas and postal ZIP codes do not align perfectly. The ZIP code in the register is as reported, and individual records can carry entry errors.
Foundation: the slab takes everything
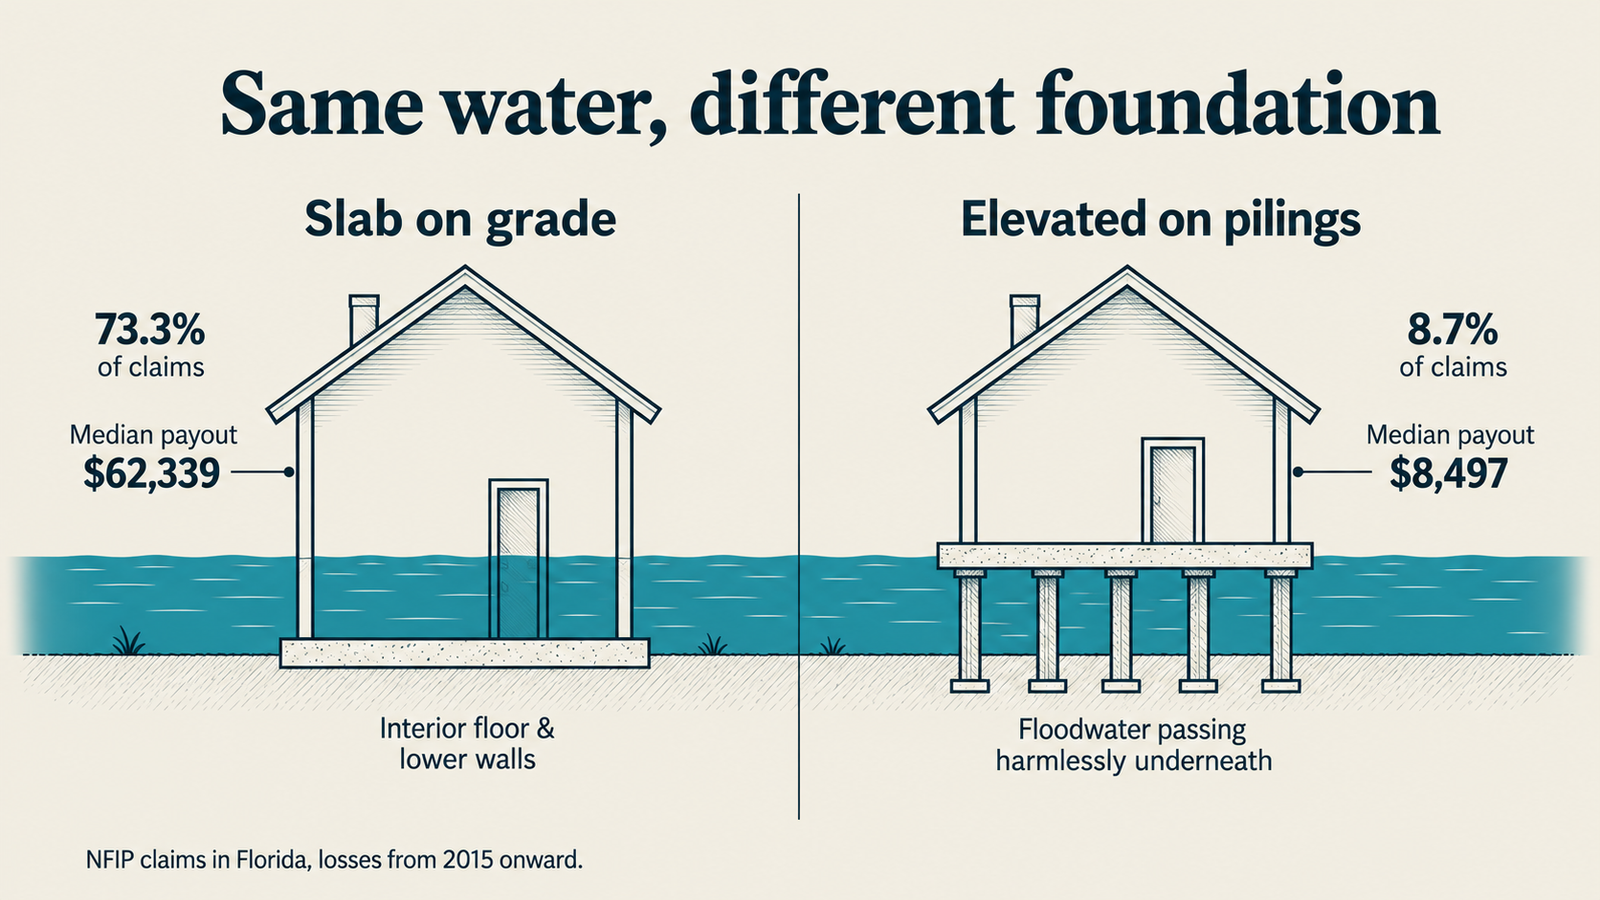
The foundation field is only filled in consistently from 2015 onward, so this section counts losses from 2015 and later.
On smaller screens, scroll the table to see every column.
| Foundation | Share of claims | $ billion | Median payout |
|---|---|---|---|
| Slab on grade | 73.3% | 12.07 | $62,339 |
| Elevated on piles, with enclosure | 8.7% | 0.70 | $8,497 |
| Elevated on piles, no enclosure | 6.8% | 0.61 | $13,000 |
| Elevated with enclosure, not piles | 5.7% | 0.31 | $6,055 |
| Crawlspace | 4.8% | 0.54 | $25,223 |
| Basement | 0.6% | 0.09 | $10,677 |
A house on a slab fills up when the water rises. Its median payout of $62,339 runs seven times higher than the $8,497 recorded for a house on piles. And there is a second line worth reading twice: the register holds 1,098 basement claims for the entire state, six tenths of one percent. Northern advice about checking the basement for damp rests on a form of construction that barely exists in Florida.
Rain floods more often, the sea costs more
On smaller screens, scroll the table to see every column.
| Cause of loss | Share of claims | $ billion | Median payout |
|---|---|---|---|
| Accumulation of rainfall | 46.4% | 7.88 | $5,136 |
| Tidal water | 30.9% | 8.85 | $14,801 |
| River, stream or lake | 7.7% | 1.47 | $12,076 |
Close to half of all Florida claims come from accumulated rainfall rather than storm surge. Tidal water still carries the larger share of the money on roughly two thirds as many claims, and its median payout runs almost three times higher. So much for the instinct that a coastal state floods from the sea: more often, it floods from the sky.
One year, 2024, holds 40.8% of the money
On smaller screens, scroll the table to see every column.
| Year | Claims | $ million |
|---|---|---|
| 2024 | 80,436 | 7,873 |
| 2022 | 50,323 | 4,953 |
| 2004 | 34,726 | 1,250 |
| 2017 | 31,430 | 1,031 |
| 2005 | 32,420 | 625 |
By event, Hurricane Helene accounts for $6,462 million, Ian for $4,872 million, Milton for $1,205 million and Irma for $980 million. Irma produced 28,756 claims yet an average loss roughly a third the size of Helene and Ian: claim counts and damage severity measure different things.
Adjusting for inflation using CPI-U, which covers 86.0% of the payouts, the total across covered years comes to $19.53 billion in 2025 dollars. The 2004 season roughly doubles in real terms and moves clearly into third place.
What this data does not show
NFIP covers flooding: external water rising onto normally dry land. Roof leaks, burst pipes, an overflowing condensate line, condensation and mold are not part of the program. Every figure on this page is a floor on water damage in Florida, not the whole picture. If your problem started inside the house, the relevant reading is mold after a water leak rather than anything in this register.
The amounts are insurance settlements paid, not damage estimates and not the market cost of restoration. Only properties insured through NFIP appear here; private flood policies and uninsured housing are absent entirely. Claims closed without payment, 30.1% of the total, do not indicate bad-faith denial, and the reasons were not analysed in this extract. The system of record is current as of 16 July 2026.
City-level breakdowns built on the same extract are available for Miami, Tampa and Orlando.
Sources
- OpenFEMA Dataset: NFIP Redacted Claims – v3, retrieved 28 July 2026. This product uses the FEMA API but is not endorsed by FEMA. The federal government and FEMA bear no responsibility for the data or the conclusions drawn after it left the agency’s site.
- OpenFEMA Dataset: NFIP Residential Penetration Rates – v1, data as of 29 April 2026.
- U.S. Census Bureau, American Community Survey 5-year estimates 2023, table B25001, Total Housing Units by ZIP Code Tabulation Area.
- U.S. Bureau of Labor Statistics, CPI-U all items, series CUUR0000SA0.
- FEMA Mapping Information Platform, community naming convention for unincorporated areas of a county.
Frequently asked questions
Which Florida county has the worst water damage record?
By absolute dollars, Lee County leads with $3.95 billion in NFIP payouts. Measured per 1,000 residential structures, Monroe County in the Florida Keys leads by a wide margin at 720 claims per thousand homes across 1978–2026.
Do houses outside the flood zone still flood?
Yes. 10.9% of all NFIP payouts in Florida went to properties in Zone X, which sits outside the high-risk special flood hazard area on FEMA maps.
Which houses appear most often in the payout statistics?
Homes built before 1980 account for 61.7% of claims and 71.4% of the money paid. By foundation, slab-on-grade houses account for 73.3% of claims with a median payout of $62,339.
Does Florida flood more from rain or from the sea?
From rain, by claim count: 46.4% of claims come from accumulated rainfall against 30.9% from tidal water. Tidal water is the more expensive of the two, carrying more money on fewer claims.
Does NFIP cover leaks and mold?
No. The program covers flooding, meaning external water rising onto normally dry land. Burst pipes, roof leaks and condensation fall under other policies.