
Mold Remediators by County: Florida’s Licensed Market
Florida keeps an open register of everyone allowed to inspect and remove mold, which makes it possible to count mold remediators by county without asking anyone’s permission. The file sits on a state server, refreshes weekly and weighs about half a megabyte. We downloaded it on August 4, 2026 and counted.
The register holds 5,306 active licenses. Behind them stand fewer people: 3,936. The gap has a simple cause. Some 1,370 individuals hold two licenses at once, assessor and remediator. That is roughly one in three of everyone licensed in the state.
One caveat before the numbers, because without it they read wrong. The county in the register is the county of the licensee’s mailing address, not the area they work. A remediator based in Fort Lauderdale takes jobs in Miami and Boca Raton without a second thought. It runs the other way too: where a county shows zero, crews drive in from next door. Zero means nobody is registered there. It does not mean nobody comes.
Mold remediators by county: the full table
Of the 5,306 licenses, 4,924 sit in Florida counties. Another 264 belong to people with out-of-state addresses, and 118 records carry no address at all, which licensees are entitled to withhold.
| County | Assessors | Remediators | Population | Per 100k | Per 10k homes |
|---|---|---|---|---|---|
| Broward | 390 | 392 | 1,946,127 | 20.1 | 4.5 |
| Miami-Dade | 396 | 343 | 2,685,296 | 12.8 | 3.2 |
| Palm Beach | 250 | 250 | 1,507,453 | 16.6 | 3.5 |
| Hillsborough | 161 | 128 | 1,489,634 | 8.6 | 2.1 |
| Orange | 134 | 124 | 1,440,471 | 8.6 | 2.2 |
| Lee | 129 | 122 | 792,692 | 15.4 | 2.8 |
| Pinellas | 117 | 118 | 960,565 | 12.3 | 2.3 |
| Duval | 71 | 68 | 1,007,189 | 6.8 | 1.5 |
| Pasco | 70 | 65 | 588,758 | 11.0 | 2.5 |
| Brevard | 67 | 55 | 620,533 | 8.9 | 1.9 |
| Seminole | 60 | 55 | 474,912 | 11.6 | 2.8 |
| Collier | 53 | 49 | 387,681 | 12.6 | 2.1 |
| St. Lucie | 50 | 48 | 346,237 | 13.9 | 3.1 |
| Volusia | 48 | 47 | 568,229 | 8.3 | 1.7 |
| Sarasota | 45 | 41 | 449,011 | 9.1 | 1.6 |
| Osceola | 48 | 36 | 406,943 | 8.8 | 2.2 |
| Lake | 42 | 35 | 398,696 | 8.8 | 1.9 |
| Manatee | 41 | 35 | 416,020 | 8.4 | 1.6 |
| Polk | 33 | 40 | 760,961 | 5.3 | 1.2 |
| St. Johns | 38 | 32 | 292,243 | 10.9 | 2.5 |
| Marion | 28 | 24 | 387,697 | 6.2 | 1.3 |
| Charlotte | 21 | 29 | 195,083 | 14.9 | 2.5 |
| Bay | 24 | 26 | 181,368 | 14.3 | 2.4 |
| Alachua | 17 | 25 | 281,751 | 8.9 | 2.0 |
| Martin | 20 | 21 | 160,464 | 13.1 | 2.6 |
| Hernando | 19 | 19 | 201,512 | 9.4 | 2.1 |
| Escambia | 21 | 17 | 323,275 | 5.3 | 1.2 |
| Leon | 13 | 18 | 295,335 | 6.1 | 1.3 |
| Santa Rosa | 13 | 14 | 193,719 | 7.2 | 1.8 |
| Indian River | 11 | 14 | 163,856 | 8.5 | 1.6 |
| Clay | 16 | 9 | 223,436 | 4.0 | 1.0 |
| Okaloosa | 8 | 14 | 214,281 | 6.5 | 1.4 |
| Walton | 8 | 11 | 79,846 | 13.8 | 1.9 |
| Nassau | 7 | 10 | 94,653 | 10.6 | 2.3 |
| Flagler | 9 | 7 | 121,710 | 5.8 | 1.2 |
| Citrus | 11 | 4 | 158,693 | 2.5 | 0.5 |
| Monroe | 6 | 7 | 81,840 | 8.6 | 1.3 |
| Sumter | 7 | 5 | 137,536 | 3.6 | 0.6 |
| Highlands | 4 | 5 | 103,808 | 4.8 | 0.9 |
| Columbia | 3 | 4 | 70,755 | 5.7 | 1.3 |
| Okeechobee | 1 | 4 | 40,249 | 9.9 | 2.2 |
| Baker | 3 | 2 | 28,186 | 7.1 | 2.0 |
| Suwannee | 1 | 3 | 44,484 | 6.7 | 1.6 |
| Levy | 2 | 2 | 44,276 | 4.5 | 0.9 |
| Washington | 1 | 2 | 25,259 | 7.9 | 1.8 |
| Wakulla | 0 | 3 | 34,608 | 8.7 | 2.1 |
| Putnam | 0 | 3 | 74,235 | 4.0 | 0.8 |
| Jackson | 2 | 1 | 47,652 | 2.1 | 0.5 |
| Hendry | 1 | 2 | 40,798 | 4.9 | 1.3 |
| Gadsden | 2 | 1 | 43,642 | 2.3 | 0.5 |
| DeSoto | 2 | 1 | 34,719 | 2.9 | 0.6 |
| Bradford | 1 | 2 | 27,888 | 7.2 | 1.8 |
| Jefferson | 1 | 1 | 14,713 | 6.8 | 1.5 |
| Calhoun | 1 | 1 | 13,593 | 7.4 | 1.8 |
| Holmes | 0 | 1 | 19,626 | 5.1 | 1.2 |
| Gilchrist | 1 | 0 | 18,494 | 0.0 | 0.0 |
| Franklin | 1 | 0 | 12,418 | 0.0 | 0.0 |
Active licenses, DBPR download of August 4, 2026. Counties with no active licensee are omitted. Per 100k = remediators per 100,000 residents; per 10k homes = remediators per 10,000 housing units. Population and housing units: U.S. Census Bureau, ACS 5-year 2023.
The first thing the table shows is how tightly everything clusters. Three southeastern counties, Broward, Miami-Dade and Palm Beach, hold 2,021 licenses between them. That is 38 percent of the state across three counties out of sixty-seven. Six counties hold half of everything: add Hillsborough, Orange and Lee to the three.
Broward beats Miami-Dade, and not by a little
The oddest pair in the table sits in the first two rows.
Broward has 392 active remediators for 1,946,127 residents. Miami-Dade has 343 for 2,685,296. The smaller county wins on the raw count, with 27 percent fewer people.
Per head the gap opens to half again: 20.1 remediators per 100,000 residents against 12.8. A factor of 1.57.
Put in plainer terms, Broward has one active remediator for every 4,964 residents. Miami-Dade has one for every 7,828.
Count against housing instead of people and the gap narrows but survives: 4.5 against 3.2 per 10,000 housing units, a factor of 1.41. The difference between the two multipliers comes from Miami-Dade holding more homes per resident than Broward.
These two counties are ninety minutes apart on I-95. Same climate, same metro, same building tradition. Why the market settled this way, we do not know. Three testable explanations came back empty, which is further down.
From 20.1 to 2.5: an eightfold spread
Counties below 50,000 residents are left out of the ranking. Otherwise a single licensee in a county of seven thousand outranks Broward and the list turns into noise.
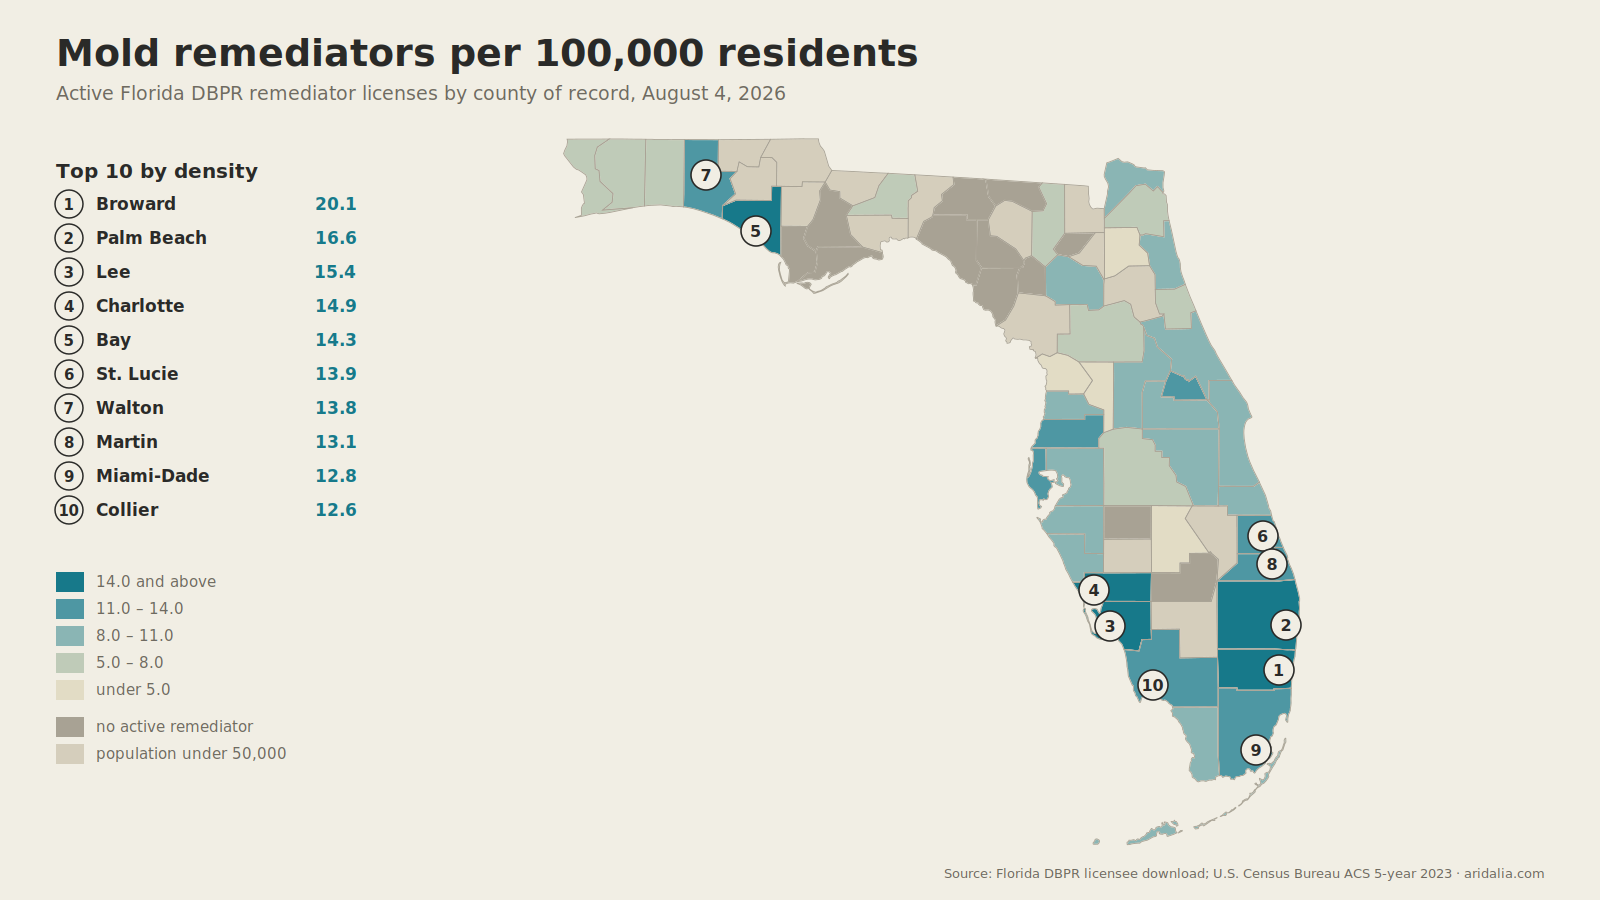
Top ten per 100,000 residents: Broward 20.1, Palm Beach 16.6, Lee 15.4, Charlotte 14.9, Bay 14.3, St. Lucie 13.9, Walton 13.8, Martin 13.1, Miami-Dade 12.8, Collier 12.6.
Bottom ten: Leon 6.1, Flagler 5.8, Columbia 5.7, Polk 5.3, Escambia 5.3, Highlands 4.8, Putnam 4.0, Clay 4.0, Sumter 3.6, Citrus 2.5.
Not one inland county makes the top ten. All ten touch water: the southeastern three, the southwestern run of Lee, Charlotte and Collier, the Treasure Coast pair of St. Lucie and Martin, and two Panhandle counties, Bay and Walton.
The bottom ten reads almost as a mirror. Polk, Highlands, Sumter, Columbia, Putnam and Clay all sit inland. Leon is Tallahassee, Escambia is Pensacola.
Citrus closes the list at 2.5. Four active remediators for 158,693 residents.
Twelve counties with no remediator at all
Ten Florida counties have no active licensee registered, neither assessor nor remediator: Dixie, Glades, Gulf, Hamilton, Hardee, Lafayette, Liberty, Madison, Taylor and Union.
Two more, Gilchrist and Franklin, have a single assessor each. Somebody can inspect a house there. Nobody can do the work.
That makes twelve counties without a remediator.
Taylor stands out on that list. Idalia came ashore there in August 2023 and Helene in September 2024. Two hurricanes in thirteen months into a county with no mold specialist on the books.
Again: this does not mean residents of Taylor have nowhere to turn. It means somebody drives in, and the drive lands on the invoice. Whether the job needs a professional at all is a separate question, and our guide to doing it yourself versus hiring out covers where the line falls.
Two rankings, because there are two questions
Counting specialists against residents is the obvious move. But mold does not grow in people, it grows in buildings, and the number of homes per resident varies sharply across Florida counties.
So we ran a second measure: remediators per 10,000 housing units. The order shifts, and it shifts in a way that makes sense.
| County | Rank by population | Rank by housing stock |
|---|---|---|
| Walton | 7 | 25 |
| Monroe | 25 | 42 |
| Sarasota | 18 | 33 |
| Collier | 10 | 17 |
| Orange | 26 | 15 |
| Seminole | 12 | 6 |
| Miami-Dade | 9 | 3 |
Rank 1 = highest density. Denominators: residents and housing units, ACS 5-year 2023.
The counties that fall are the resort ones: Walton with its stretch of 30A, Monroe with the Keys, Sarasota, Collier, Bay. Each has far more housing per permanent resident than the state average, second homes and seasonal rentals. Some of that housing sits empty through the summer, when Florida humidity runs at its highest.
Moving the other way are the Greater Orlando counties, Orange, Seminole and Osceola. Dense permanent population, little seasonal stock. And Miami-Dade, where a tower holds a hundred units and one visit serves them all.
Folding these two lists into one would be dishonest. The first answers how many specialists there are per person. The second, how many per building they actually service.
Assessors and remediators: why the numbers match
Statewide there are 2,724 assessors and 2,582 remediators. A ratio of 1.05, effectively one to one.
That fits Florida law. Fla. Stat. §468.8419 bars an assessor from remediating a property they inspected in the previous twelve months, and mirrors the rule for remediators inspecting what they cleaned. The logic is plain: whoever profits from removing mold should not be the one deciding whether it is there. If you are hiring, our breakdowns of what an inspection costs and what remediation costs in Florida follow that same split.
There is an exception that rarely gets mentioned: the rule does not apply to certified Division I contractors, and it applies to them without conditions. The statute lets the department adopt a rule requiring such a contractor to tell the homeowner in writing that they can seek competing bids, but none has been adopted: the proposed rules were withdrawn in 2014 and 2015.
Note that the ban attaches to the property, not the person. Nothing stops one individual from holding both licenses, and 34.8 percent of licensed individuals in Florida do. In Miami-Dade the share is the highest of any large county at 45.5 percent.
Inside counties the parity breaks up. Alachua sits at 0.68, well weighted toward remediators. Osceola at 1.33, the other way. Palm Beach lands on exactly 250 and 250.
What we tested and did not find
That spread invited an explanation. We took three measurable variables and ran Spearman rank correlations across the 28 counties holding at least thirty licenses.
The threshold was set before the calculation: anything under 0.30 counts as no relationship.
County population came back at 0.238. Housing units at 0.207. Median year the housing was built at 0.311, nominally over the line, but with 28 counties that carries a significance level near 0.11. It does not count.
None of the three held. Size of county, volume of housing stock and age of construction do not explain the spread.
We could invent something. Condominium share, insurance practice, business language, historical habit. Inventing is easy and there is nothing to test it against. So we say it plainly: the cause is unknown.
When these licenses were issued
The register carries the date of each licensee’s first license, and that date traces the whole history of mold regulation in Florida.
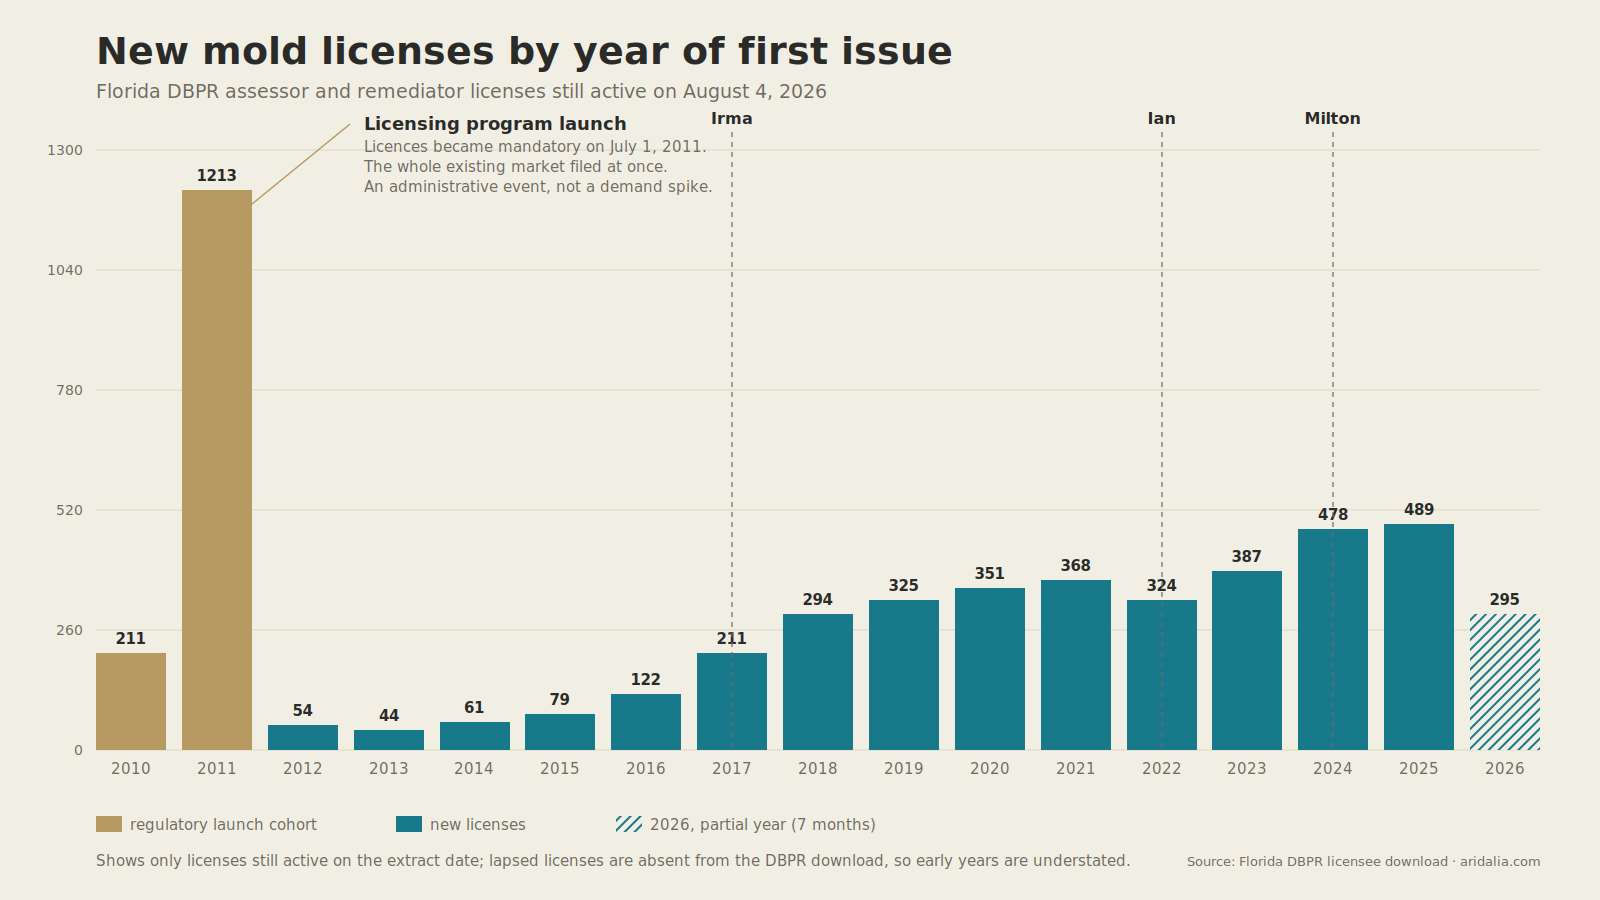
The earliest date in the file is July 13, 2010, licence number 0000001. The licensing programme launched that summer, and the licence became mandatory on July 1, 2011.
The result: 1,424 of today’s active licenses carry 2010 or 2011 dates, 26.8 percent of the total. The entire working market filed its paperwork at once. That is an administrative event, not a demand spike, and reading it as one would be wrong.
Then a trough. From 2012 through 2015 the annual count runs between 44 and 79. The queue had already been cleared.
From 2016 the growth is unbroken: 122, 211, 294, 325, 351, 368. Then 387 in 2023, 478 in 2024, 489 in 2025. Seven months into 2026 the count already stands at 295, so the pace is holding.
Hurricanes do not show up in these numbers
Common sense says a major storm should be followed by more mold specialists. We checked that county by county, quarter by quarter, in the counties that took direct hits.
Milton came ashore at Siesta Key on October 9, 2024. In that quarter the four affected counties, Sarasota, Manatee, Hillsborough and Pinellas, produced sixteen new remediator licenses. A record at the time. But a year earlier, with no Milton anywhere, the third quarter of 2023 produced thirteen, and 2023 as a whole produced thirty-four against twenty-one in 2021. The rise started before the storm and carried on afterwards at the same slope.
Ian, September 2022, Lee and Charlotte. The quarter after the storm produced three licenses, the same as the quarter before the season. The climb begins in 2023 and spreads across years, and the same values turn up in 2019 and 2021.
Irma and Michael give too little to work with. In Monroe and Collier, and in Bay and Gulf, the count runs to single licenses per quarter.
No connection is visible. Two explanations are plausible, and both are reasonable. The first: what a property needs immediately after a storm is extraction, drying and demolition, which are different trades under different licenses. Mold turns up weeks later. The second: a licence takes months to obtain, so even a real influx smears across quarters until it disappears into the noise. Either way, testing after a flood sits on a different clock from the licence register.
One limitation worth stating
Everything above about years shows survivors, not entrants.
Mold licenses expire on July 31 on a two-year cycle. Anyone who does not renew drops out of the download. So the early years in the table are systematically thinner than the late ones, and the rising line from 2016 to 2025 is partly market growth and partly attrition of older cohorts.
One snapshot cannot separate the two. We saved a copy of the August 4, 2026 file. The department keeps no archive and overwrites the file in place, so the only way to build a time series is to accumulate one, which is what we are doing.
How we counted
Source: the public licensee download from the Florida Department of Business and Professional Regulation, file lic07mold.csv, retrieved August 4, 2026. The file holds 5,968 rows.
The count covers records with a Current primary status and an Active secondary status, across two licence types: MRSA for mold assessors and MRSR for mold remediators. Continuing-education course providers are excluded.
Our Florida DBPR license data guide explains the file layout, status codes, update schedule, and related public extracts.
Population and housing stock come from the American Community Survey, five-year estimates for 2023, tables B01003 and B25001. Median year built is B25035.
Unique individuals were identified by matching name, first address line and ZIP code.
The department’s own caveat, which matters. The download excludes records marked NULL & VOID, delinquent and involuntarily inactive. The real pool of licenses ever issued is larger than what we counted. Every figure on this page is a floor, not a ceiling.
We do not rate or recommend individual companies. The author holds no mold assessor or mold remediator licence and performs no inspections. Everything here is a count of an open state register. Our full methodology and the rest of our open-data work explain how we handle datasets like this one, and the mold section covers the practical side.
Sources
- Florida Department of Business and Professional Regulation, licensee download, mold-related services:
https://www2.myfloridalicense.com/sto/file_download/extracts/lic07mold.csv(retrieved August 4, 2026) - Florida DBPR, file layout, county codes and site disclaimer:
https://www2.myfloridalicense.com/sto/documents/readme.pdf - The Florida Senate, Fla. Stat. §468.8419, Prohibitions; penalties:
https://www.flsenate.gov/Laws/Statutes/2025/468.8419 - U.S. Census Bureau, American Community Survey 5-year 2023, tables B01003, B25001, B25035:
https://api.census.gov/data/2023/acs/acs5 - NOAA National Hurricane Center, Tropical Cyclone Reports:
https://www.nhc.noaa.gov/data/tcr/
Questions people ask
How many licensed mold remediators are there in Florida?
The DBPR download for August 4, 2026 holds 2,582 active remediator licenses and 2,724 assessor licenses, 5,306 in total. Those licenses belong to 3,936 people, because many hold both.
Which Florida county has the most mold remediators?
Broward, with 392 active remediator licenses. It also leads per head of population at 20.1 per 100,000 residents.
Are there Florida counties with no mold remediator?
Yes. Twelve counties have no active remediator license registered. That is not the same as having no help available: crews travel from neighbouring counties.
Can the same company inspect and remediate mold in Florida?
Not on the same property inside twelve months, under Fla. Stat. §468.8419. Certified Division I contractors are exempt from that paragraph.
Why is the licence count higher than the number of people?
Nothing stops one person from holding both an assessor and a remediator licence. In Florida 34.8% of licensed individuals do.